
Forum Replies Created
-
AuthorPosts
-
Hello Seena,
This seems to be about the similar problem on a recent thread. I also checked the specific slice you mentioned on this thread, it’s something about the UTAH site causing problems. We can follow on the other thread.
Best regards,
MertJuly 23, 2026 at 6:13 pm in reply to: Slice stuck on configuring state without modifying the slice #9910Hello Seena,
I checked your slice and I see some errors occurred for the network configuration, then reservations for most part of the slice are closed. I’m sure the FABRIC team is/will be monitoring this thread, but I will also share with them. For now, I can suggest recreating the slice. If you have UTAH node on your topology and receive errors, then you can try replacing UTAH with another site. We will get back on this.
Best regards,
MertThe issue is resolved, MAX is available for experiments.
Persistent storage volumes will remain with all the data in them and you will have them available when the site is back online after the maintenance. However, the VMs will be deleted and the data stored on their native disks will be affected (lost).
Work is completed.
Same situation. Rebooted, devices attached.
I’m not sure what is causing this, worker node is not extremely loaded, but inside the VMs there seem to be mellanox driver issues. If you share some context about the actual experiment and traffic (generated/exchanged) we can try to understand and find a way to have it sustain reliably. Otherwise, I don’t have any clues right now. You can directly reach out if you prefer.
Both VMs were crashed. I’m attaching the console outputs.
console.7b4c35dd-c7d1-4d29-9ca0-c71d21e6089e-r-2-1
console.c834417a-7393-4cae-bd62-722358b6451f-r-2-3I restarted them, they are online. I also attached their PCI devices (IP addresses need to be re-assigned).
We are checking on the status information for cern-w2 with respect to potential mismatch
due to a reservation that is currently consuming the resource but health of the reservation is not clear.
We will send updates.1 user thanked author for this post.
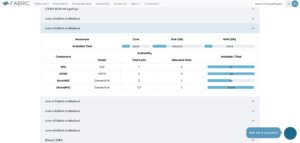
An easy way that works for me is checking the portal for the specific worker node’s resources. On the CERN, cern-w2 seems to be matching your needs. I will attach a screenshot from the portal but I’m not sure how it will show up on this comment, you can go to portal.fabric-testbed.net, click a link that leads to the CERN page (either from the map or from the table), then see the available resources. (if these are already known to you, then please disregard)
To target a specific worker node that has the desired resources, there may be some example functions within the example Jupyter notebooks that show filtering the worker nodes, and listing their resources. Or Fablib API documentation may reveal some ways, I don’t know much about that part. I guess knowledgable users from the community may share their methods.
For scheduling resources in advance, this resource may reveal some ways -> https://artifacts.fabric-testbed.net/artifacts/32938b00-5036-4a1e-84b5-063283618669
There may be some other ways to show the resource availabilities, but I will leave it to more advanced users or FABRIC team, they may have better pointers.
You need to provide the slice IDs.
ConnectX-6 SmartNICs are located on the “FastNet Worker”
GPUs are located on “GPU Worker” and “SlowNet Worker”You can find information on this page -> https://learn.fabric-testbed.net/knowledge-base/fabric-site-hardware-configurations/
So, it will not possible to have both GPU and ConnectX-6 on the same VM.
However, CERN is an exception. It has 3x “FastNet Worker” servers. Each server has 2x ConnectX-6 SmartNIC and 1x A30 GPU on them.MAX is available for the experiments.
April 21, 2026 at 12:34 pm in reply to: Inquiry Regarding MAX Site Maintenance Completion Timeline #9697Hi Ajay,
MAX is back online. Maintenance status is released but it may take some time to indicate the available status on the portal. Regardless it’s available for the experiments now.
Best regards,
MertProblem on the server (seat-w1) was caused by the Nvidia BlueField-3 DPU card. Currently, server is back online (active VM slivers are recovered), however we took out the DPU card for investigation. All other resources on the SEAT node are available for experiments.
Hi Ajay,
The problem is caused by a hardware failure on the head-node of the MAX site. Work is in progress to recover the server, however it’s very likely that it will require some extra time. I wanted to let you know in case these are the slices for your demo, you may need to re-create them on other FABRIC nodes/sites.
I will notify if we are able to resolve the probkem on MAX and your current slices can be recovered.
Best regards,
Mert
-
AuthorPosts