
ELK is the acronym for three open source projects: ElasticSearch, Logstash, Kibana. Elasticsearch is a search and analytics engine. Logstash is a server-side data processing pipeline that ingest data from multiple sources simultaneously, transform it and then sends it to Elasticsearch. Kibana lets users visualize data with charts and graphs using collected data in Elasticsearch.
https://www.elastic.co/what-is/elk-stack
- Elasticsearch: This is the heart of the stack, a distributed search and analytics engine. It stores the processed data in an indexed format, making it searchable and analyzable.
- Kibana: This is the visualization layer. It connects to Elasticsearch to query the data and create interactive dashboards, charts, and graphs for analysis.
- Logstash: This is the data collection and processing engine. It takes data from various sources, processes and transforms it (parsing, filtering, enriching), and then sends it to Elasticsearch.
- Filebeat: This is the most common Beat. It’s used for shipping log files. Filebeat monitors the log files or locations you specify, collects log events, and forwards them to either Logstash or Elasticsearch. It’s designed to handle backpressure, meaning it won’t lose data if Logstash or Elasticsearch become temporarily unavailable.
- Heartbeat: This Beat is for uptime monitoring. Heartbeat sends simple probes to your services to check if they are up and running. It reports on the availability and response time of your hosts and services, sending this data to Elasticsearch where it can be visualized in Kibana to create a dashboard of your service’s uptime.
- Metricbeat: This Beat collects metrics from your systems and services. It can collect metrics from an operating system (e.g., CPU, memory, disk usage) or from services like Apache, NGINX, or MySQL.
- Packetbeat: This Beat captures network packets. It’s a network packet analyzer that decodes common application-layer protocols (HTTP, MySQL, Redis, etc.) and sends the data to Elasticsearch.
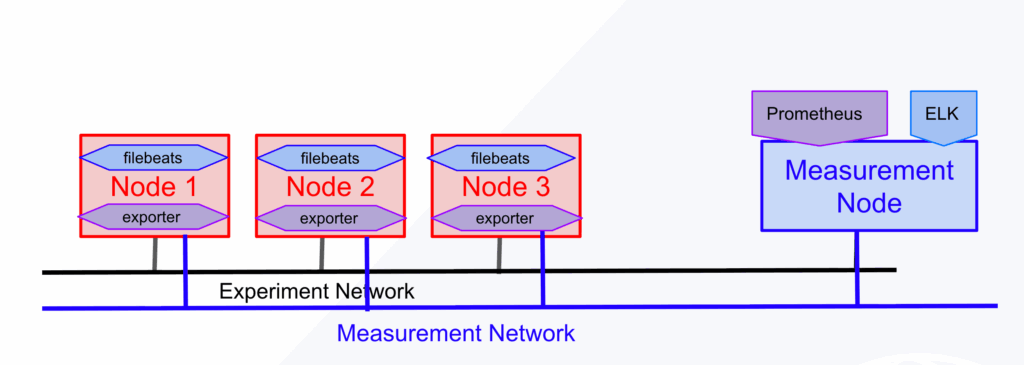
MFlib’s example slice topology
The image below is an MFLib-based monitoring slice in FABRIC, where experiment nodes are instrumented with filebeats and exporters, and all monitoring data flows through a separate measurement network into a central measurement node(_meas_node) running Prometheus + ELK.
For the detail
Requirements for Elasticsearch node (_meas_node)
Each Elasticsearch node requires 1GB of RAM to run the 3-node cluster. Make sure to create _meas_node with enough RAM. By default, the _meas_node is created with 2 CPU cores, 100GB storage and 8GB RAM.