
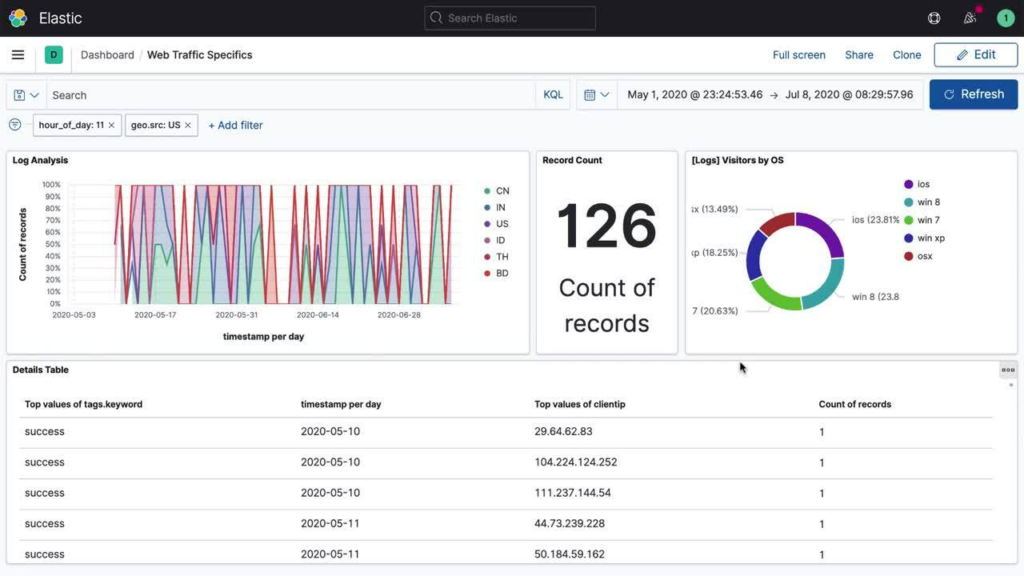
Kibana offers visualizations of various Beat data in the form of dashboards. Mflib.update offers users a way to upload their own dashboard files to visualize data in their preferred way.
1. Upload .ndjson file(s) to Jupyter
Kibana dashboard files will have the .ndjson extension. Upload these dashboard files to Jupyter, preferably in a separate folder.
2. Run mf.instrumentize()
The measurement Beats and the ELK stack must be up and running before one can upload dashboard files. Ensure mf.init() and mf.instrumentize() have ran.
3. Run mflib.update()
Running this command with the proper data{} information will upload the files to the measurement node and then import them into Kibana.
data={"cmd":["upload_custom_dashboards", "add_custom_dashboards"], "dashboard_filenames":<DASHBOARD_FILENAME>}
mf.update("elk", data, dashboard_filenames)
<DASHBOARD_FILENAME> should contain the full path name to the .ndjson file. <DASHBOARD_FILENAME> may also be an array containing full path names to each .ndjson file. The following code block is able to upload multiple files at once:
dashboard_filenames = []
dashboards_folder = <PATH_TO_FOLDER>
for file in os.listdir(dashboards_folder):
    if file.endswith(".ndjson"):
        dashboard_filenames.append(os.path.join(dashboards_folder, file))
        data={"cmd":["upload_custom_dashboards", "add_custom_dashboards"], "dashboard_filenames":dashboard_filenames}
mf.update("elk", data, dashboard_filenames)
*Note: some filenames may cause issues when uploading. It is known that having parentheses in the filename may cause the dashboard to fail when uploading. Other cases may arise. If “uploaded dashboard <FILENAME>” does not appear in the output of mflib.update, renaming the filename may fix this*
*Note: if a file already exists in the ~/services/elk/files directory with the same name as a .ndjson file to upload, the new file will overwrite the existing one*
4. Navigate to dashboard on Kibana
Log in to Kibana and navigate to the home page. Using the menu button on the top left corner, navigate to Analytics > Dashboard. Use the search function to find the dashboard uploaded.
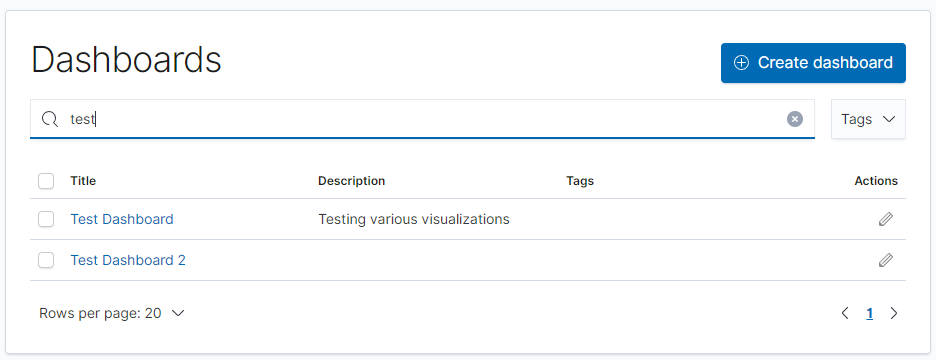
*Note: the name of the .ndjson filename does not dictate the name of the dashboard once in Kibana. Be sure to search for the dashboard name and not the filename.*
The example of this process is in this Jupyter notebook example in FABRIC examples.