The measurement framework runs a list of services that collect data from nodes in a Fabric slice. The collected data is sent to the measurement node (_meas_node) created by the Measurement Framework Library (MFLib) and added to the existing Fabric slice as an additional node for the purpose of managing measurement data.
It is important to know what timestamp the measurement framework uses to collect the data. At the same time, it is also essential to provide users with the option to visualize measurement graphs using time series in their local time zone.
Services that collect data from nodes in a slice
Prometheus
Prometheus is an open-source toolkit for system monitoring. Metrics, used for numerical measurement purposes, are collected and stored by Prometheus as time series data. Prometheus uses Unix time internally and UTC as the default timezone for display purposes. More details can be found at this link.
Beats (Filebeat, Metricbeat, Packetbeat)
Beats is a family of data shippers. Filebeat is a shipper for logs. Metricbeat deals with metric data. Packetbeat mainly focuses on network data. The collected data can be sent to systems such as Logstash or Elasticsearch for further analysis. By default, the Beats family uses UTC as the default time zone. Users can specify the offset from UTC using the add_locale processor.
Filebeat documentation can be found at this link.
Metricbeat documentation can be found at this link.
Packetbeat documentation can be found at this link.
Services for data visualization
These services allow the users to visualize the collected data using dashboards. Users can access these services using browsers. The graph time series will be converted automatically from UTC to the timezone these browsers are located in based on the browser timezone information.
Grafana
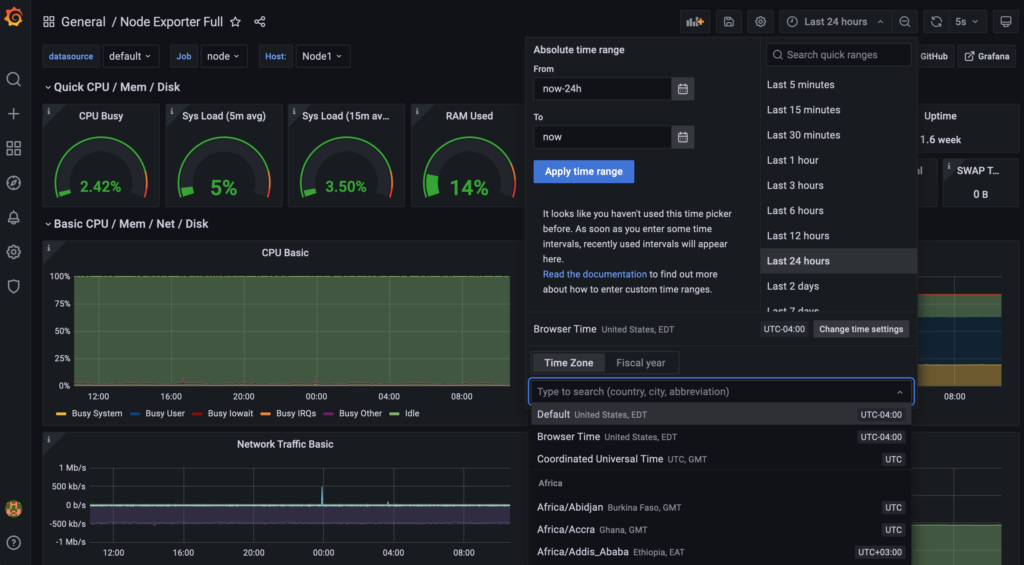
Grafana is a multi-purpose platform that helps users with visualizing and analyzing their data. Once connected to supported data sources, (e.g, Prometheus), Grafana allows users to import various dashboards to visualize data.
Users can access the Grafana server installed on the measurement node using their browsers. The timezone information of the browser is automatically detected so that the graphs will be displayed using the local timezone stamps. Users can also change the timezone on the Grafana server by clicking the time filter on the top right corner of the page.
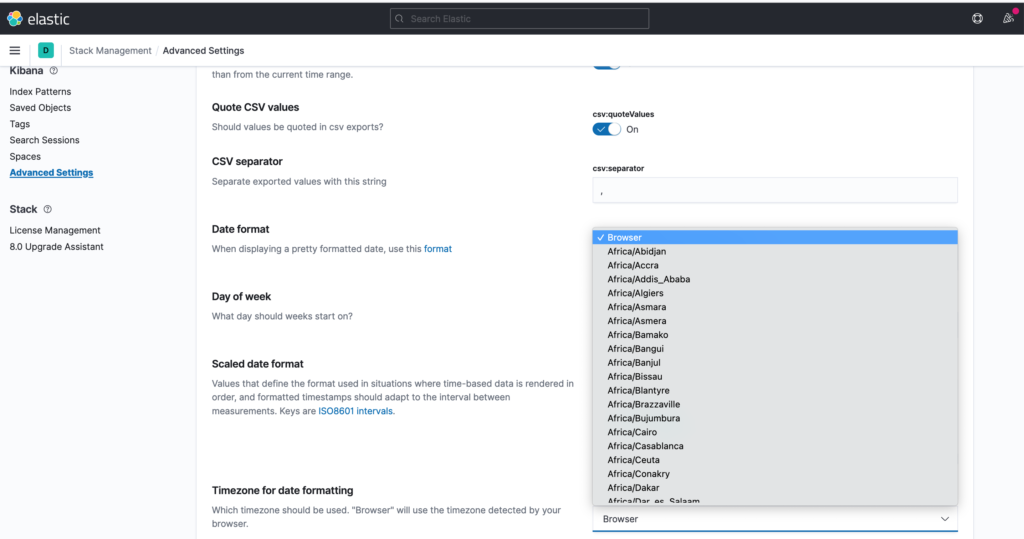
Elastic Stack
The Elastic Stack, also known as the ELK stack which stands for Elasticsearch, Logstash and Kibana. Kibana allows users to import various dashboards to visualize data. By default, Kibana uses the browser timezone information to display the dashboards. However, users can change it in the Kibana Advanced Settings, by selecting any timezone they are interested in.